Analysis
Analysis means a thorough examination of anything complex in order to comprehend its nature or determine its essential characteristics.
- Classical methods and instrumental methods can be employed.
Types of Analysis
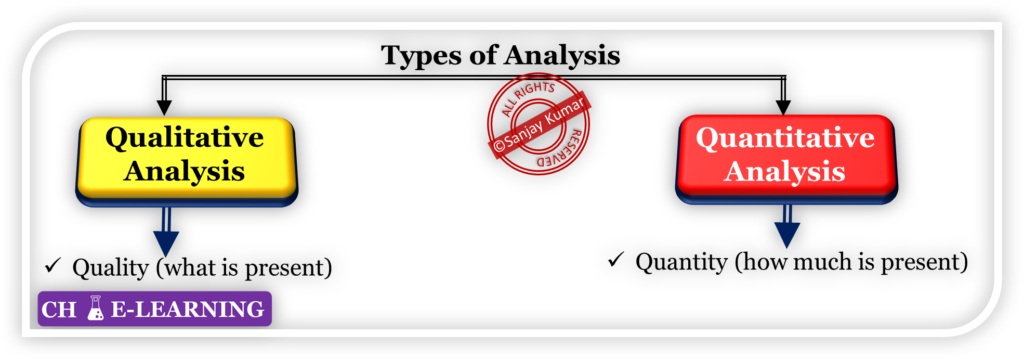
It can be of two types i.e., qualitative and quantitative.
Qualitative Analysis:
It is used for the identification of different kinds of substances present in a sample.
- It can be identified by color, indicators, boiling point, odors, etc.
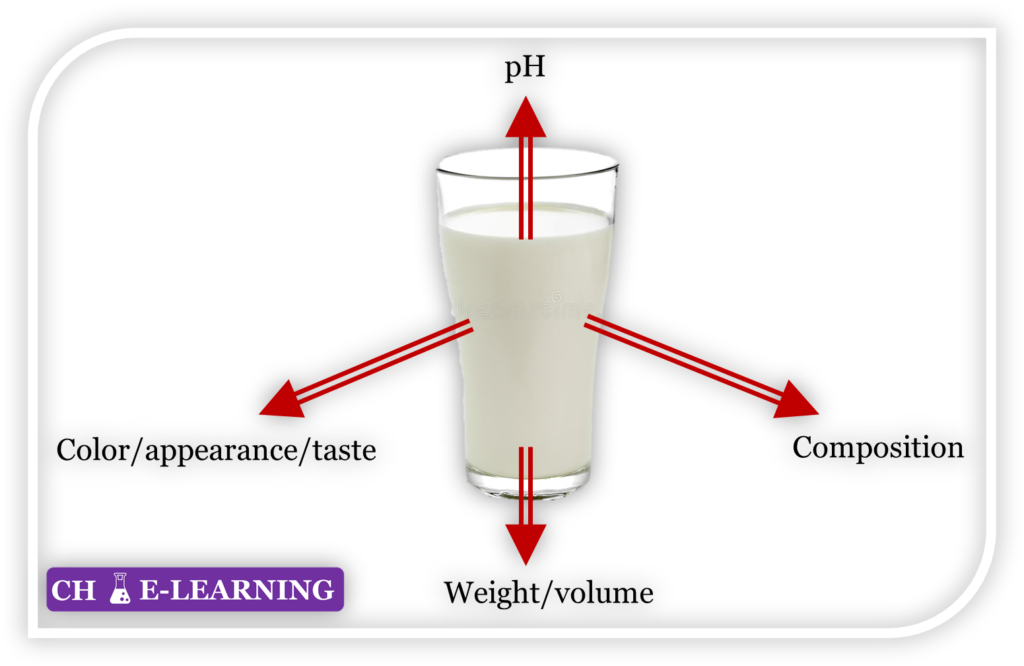
For example, look at these questions: Q 1: What is the color of the water or your shirt? Q 2: How is the taste of milk?
- To answer the above questions, no. is not required.
Quantitative Analysis:
It is used for the determination of different kinds of substances present in a sample. For example, estimating mass or volume.
- Some empirical relationship needs to be developed for quantification.
For example, look at these questions: Q 1: How much money do you have in your pocket? Q 2: How old are you?
- To answer the above questions, no. is required.
Analytical Methods
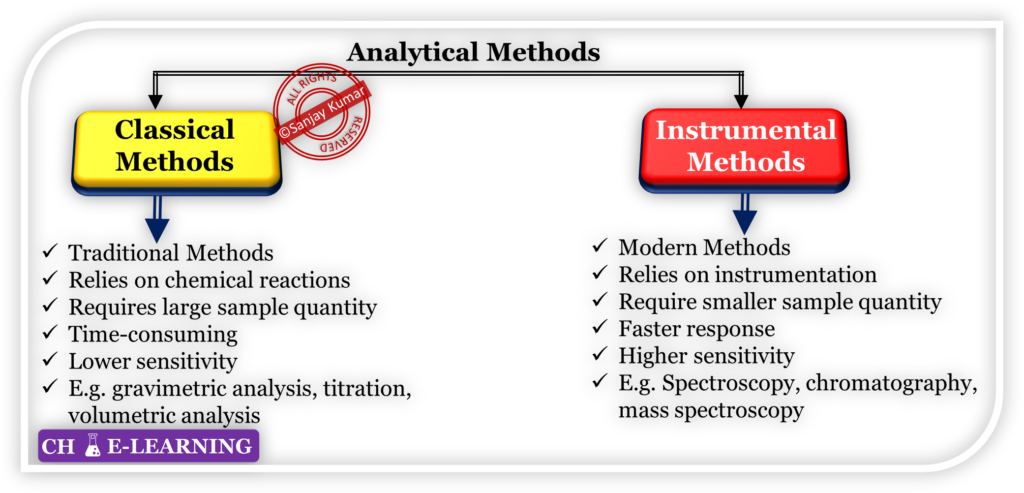
They are of two types i.e., classical and instrumental methods.
Classical Methods
They are traditional techniques that have been used for many years in analytical chemistry.
- In the early years of chemistry, most analyses were carried out by separating the components of interest (the analytes) in a sample by precipitation, extraction, or distillation.
- These methods are based on either chemical reactions or physical properties of the analyte.
Classical Methods of Qualitative Analysis:
For qualitative analyses, classical methods involve the separation of components followed by treatment with specific reagents to produce products that could be identified based on their:
Colors: The formation of colored compounds can indicate the presence of certain elements or functional groups.
Boiling or Melting Points: Determining the boiling or melting points of the separated components can provide clues about their identities.
Solubilities in Solvents: The solubility behavior of the components in a series of solvents can help identify their chemical properties.
Odors: Some compounds have characteristic odors that can aid in their identification.
Refractive Indexes: Determining the refractive index of a substance can give insights into its composition and purity.
Chemical Test::
Typically, a fast reaction is performed in a test tube that gives drastic changes such as color, gas formation, precipitation, etc. For example, the iodine test
Iodine test: It is used to test for the presence of starch.
- A solution of iodine (I2) and potassium iodide (KI) is used.
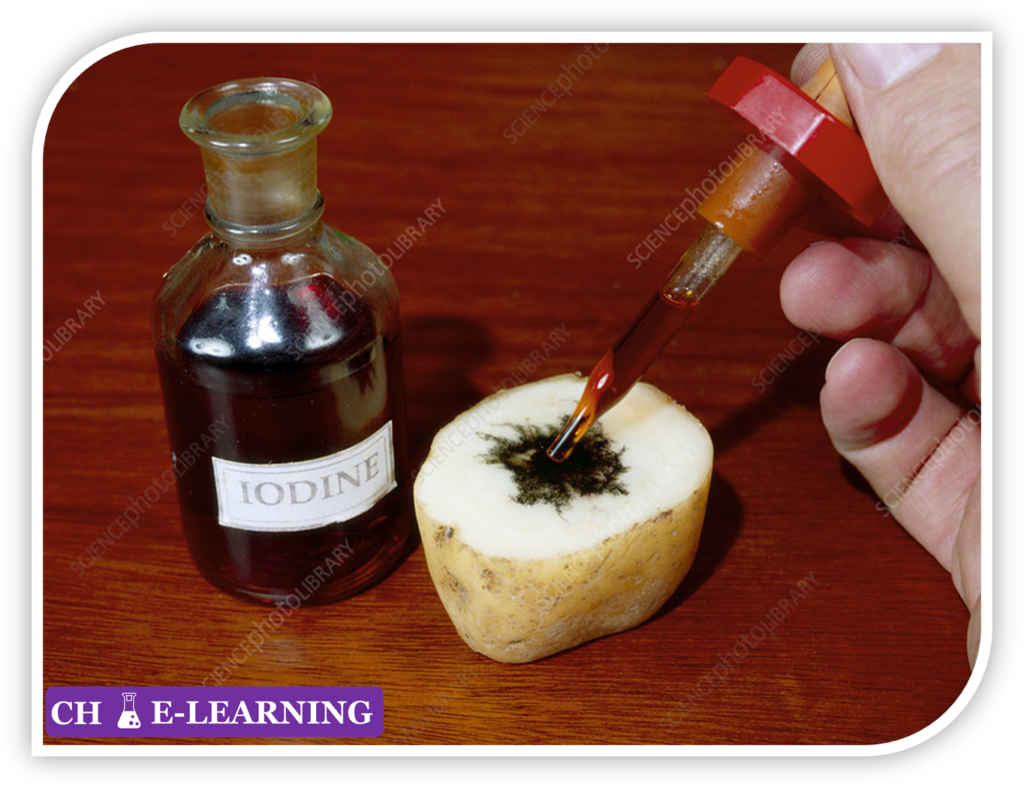
- In the presence of iodine, the color of the sample changes to Blue-black.
Flame Test::
The given compound is placed in the flame of a gas burner, there may be a characteristic color given off that is visible to the naked eye.
- It is used to identify an element or ions present in a given compound.
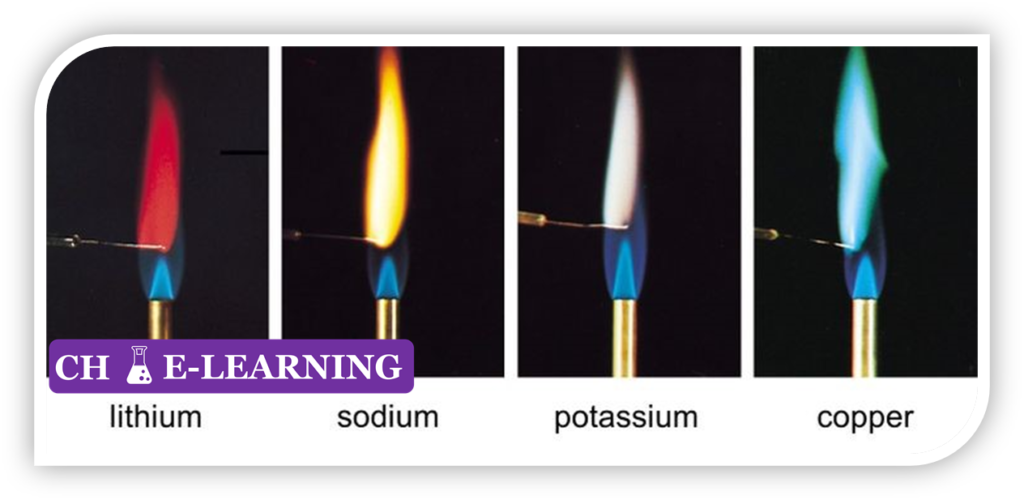
Procedure for Flame test: Take a platinum or nichrome wire.
- Clean the wire by dipping it in the concentrated solution of HCl.
- Burn it in the hot burner flame until the wire shows no color in the flame.
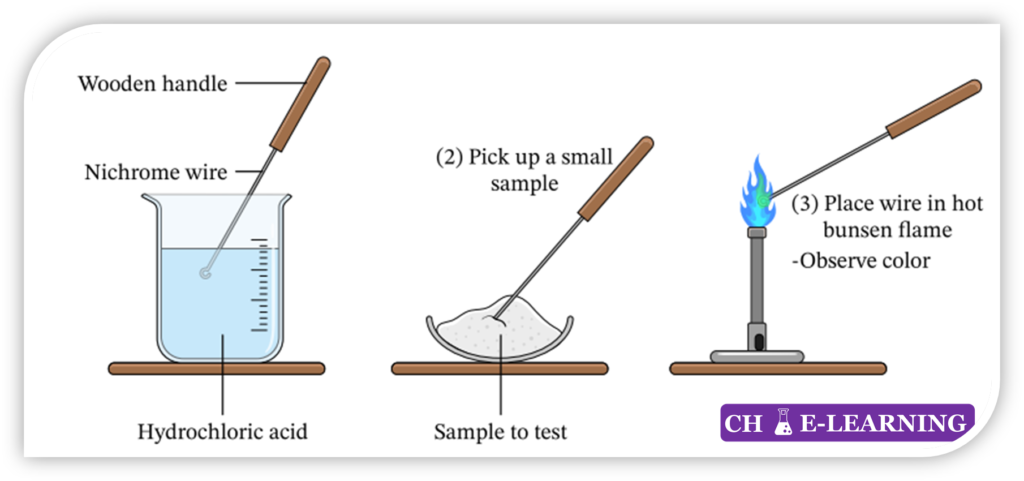
- Dip the cleaned wire into the powder or in the ionic metal salt solution, then the wire is heated in the burner flame.
- Observe the flame color.
Question: Why are platinum and nichrome wire used for flame tests?
Classical Methods of Quantitative Analysis:
For quantitative analyses, classical methods rely on gravimetric or volumetric measurements to determine the amount of analyte present in a sample.
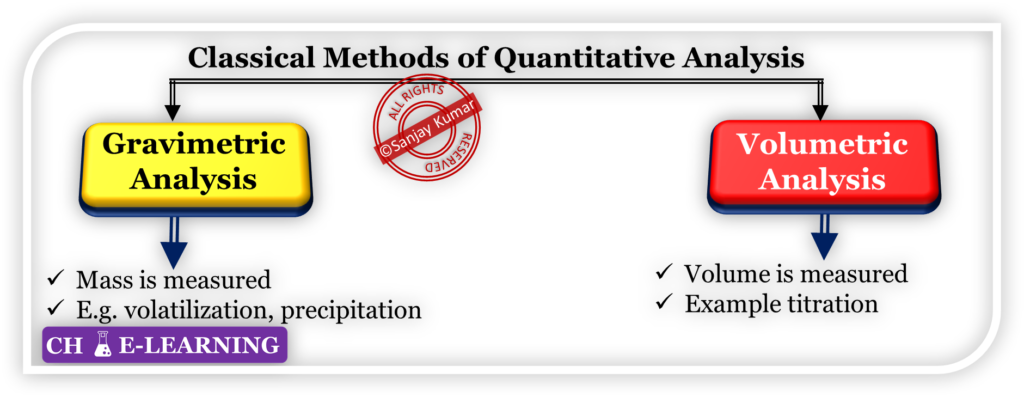
Gravimetric Analysis::
It is used for determining the amount of an analyte present in a given sample before and after some transformation. For example, we want to estimate the fat burned in the body after jogging. Then, we can measure our body weight before and after jogging to estimate fat burned.
Volatilization Method:::
This method is used for quantitative analysis when the analyte is expected to be more volatile at a suitable temperature. This method involves the following steps:
Selection of Suitable Temperature: Suitable temperature is selected at which the analyte of interest is expected to vaporize or become volatile. This temperature can be selected based on the properties of the analyte and its known volatility characteristics.
Volatilization Process: The sample containing the analyte is subjected to the selected temperature, typically through heating. As the temperature rises, the analyte vaporizes and transforms into a gaseous state.

Collection of Volatile Gas: The volatile gas containing the analyte is collected and captured in a suitable apparatus.
Weighing the Collected Gas: After the volatile gas is collected, it is weighed using a balance or another appropriate weighing instrument. The mass of the collected gas represents the amount of analyte present in the original sample.
Precipitation Method:::
The analyte is converted into a poorly soluble precipitate, then filter out analyte.
- A known amount of the sample is taken and subjected to a specific chemical treatment or reaction.
- The resulting precipitate, which is the compound formed from the analyte, is filtered, washed, and then dried to remove any moisture.
- The mass of the precipitate is measured using a balance, and from this mass, the amount of analyte in the original sample is calculated.
- For example, gravimetric analysis of chloride.
- It is used for the determination of chloride content present in the aqueous solution.

- Silver chloride is a solid substance whose solubility in water is negligible and it precipitates out in the form of white colored substance.
- Then, it is filtered, dried, and weighed.
Volumetric Analysis::
It is used for determining the concentration of an analyte present in a given solution.
- The titration method can be used.
- Concentration is an important parameter for the solution. Have you ever tasted concentrated lemon juice?

- Concentrated lemon juice, which has a higher concentration of citric acid, can have a significantly different taste compared to diluted lemon juice.
Titration Method:::
In this technique, a solution of known concentration is used to determine the concentration of an unknown solution.
Titrant or Reagent: This method requires a solution of known concentration, known as titrant or reagent.
- It is often a solution of a strong acid or base or another reagent that can react with the analyte in a controlled manner.
- The known amount of titrant is poured into a burette.
Titrand: The solution of unknown concentration, which is to be analyzed, is called the titrand.
- The titrand is taken into a conical flask.
Indicator: An indicator is used in the titration process to visually signal the completion of the reaction.
- A few drops of the indicator are added to the titrand.
- The function of the indicator is to change the color at or near the endpoint of the titration.

Titration Process: The titration process begins by adding the titrant solution to the titrand solution gradually.
- The titrant reacts with the analyte present in the titrand in a stoichiometric ratio.
- The titration is performed until the reaction between the titrant and the analyte is complete.
Endpoint and Equivalence Point: It is the theoretical point where the stoichiometrically equivalent amounts of the titrant and analyte have reacted.
- At the endpoint of the titration, the indicator changes color, indicating that the reaction is complete.
Calculations: The amount of titrant used to reach the endpoint is measured accurately.
- By knowing the amount & concentration of the titrant, we can calculate the concentration of the analyte in the titrand using stoichiometry.
Instrumental Methods
In the early twentieth century, scientists began developing new ways to analyze analytes.
- They started utilizing various physical properties of analytes, such as conductivity, electrode potential, light absorption or emission, mass-to-charge ratio, and fluorescence, for quantitative analysis.
- These newer methods for separating and determining chemical species are collectively known as instrumental methods of analysis.
Key points about instrumental methods are as follows:
Utilizing Analyte Physical Properties: Instrumental methods focus on measuring specific physical properties of analytes to determine their concentration or other characteristics.
- These properties can include conductivity, light absorption or emission, mass-to-charge ratio, etc.
Signal Generation: In instrumental methods, the chemical or physical property of the analyte is reflected in the form of a signal.
- The instrument used in the analysis generates this signal, which provides information about the analyte.
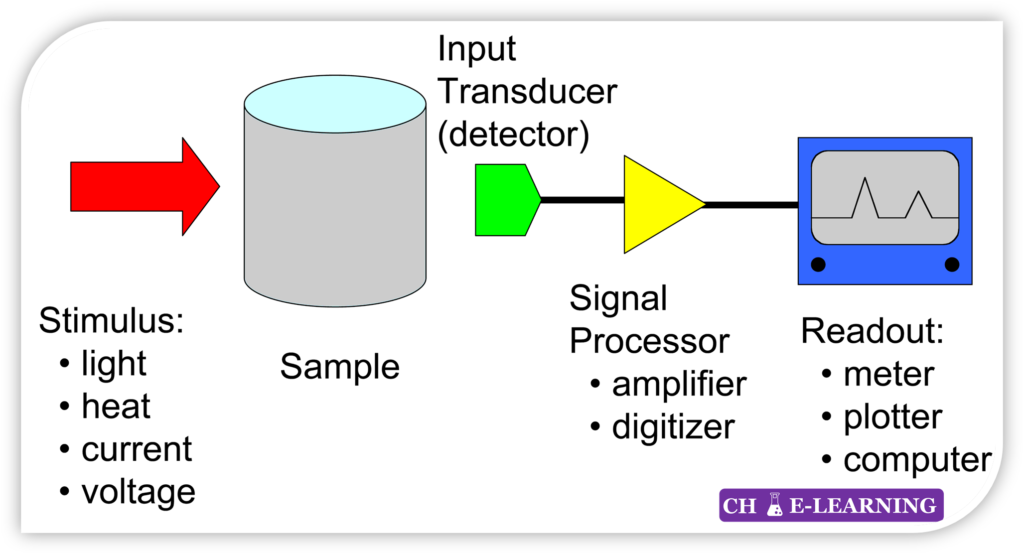
Signal Transformation: The resulting signal may be used directly, or it can be transformed into a different nature or format for easier interpretation or measurement. This transformation is known as transduction.
- For example, transducers such as photocells, thermocouples, and photomultiplier tubes convert radiant energy into electrical signals, allowing for further processing or analysis.
Instrument Readout: The transformed signal can be read and interpreted using specific devices or instruments designed for that purpose.
- These instruments may include spectrophotometers (measuring light absorption or emission), chromatographs (separating and analyzing chemical components), mass spectrometers (determining the mass-to-charge ratio of ions), or other specialized equipment.
Instrumental Methods of Qualitative Analysis:
These methods provide valuable information about the composition and properties of a sample. Here are some common instrumental methods of qualitative analysis:
Spectroscopy::
Spectroscopic methods analyze the interaction between matter and electromagnetic radiation. They provide information about the energy levels, molecular structure, and functional groups present in a compound.
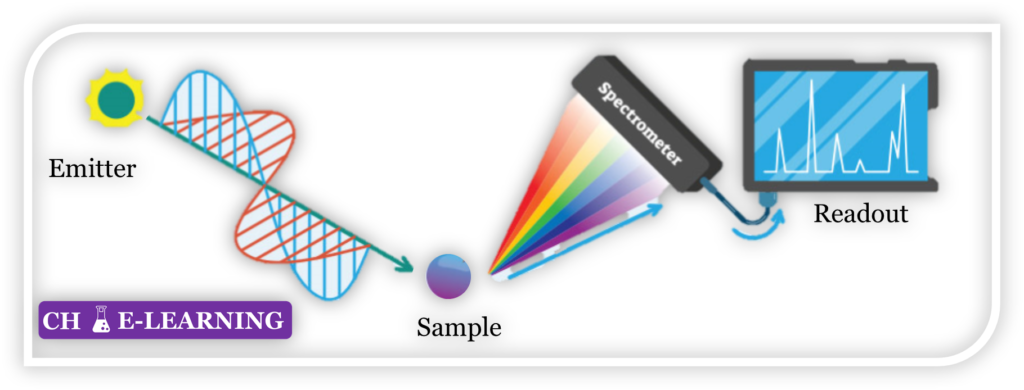
Examples include:
UV-Vis spectroscopy: Measures the absorption or transmission of ultraviolet and visible light.
Infrared spectroscopy (IR): Detects the absorption of infrared light, providing information about functional groups and molecular structure.
Nuclear magnetic resonance (NMR) spectroscopy: Utilizes the magnetic properties of atomic nuclei to determine molecular structure.
Chromatography::
Chromatographic methods separate and identify components in a mixture based on their differential affinities to a stationary phase and a mobile phase.
- It consists of a column which contains two components i.e., mobile phase & stationary phase.
- The mobile phase can be a solvent like gas, water, or organic solvent.
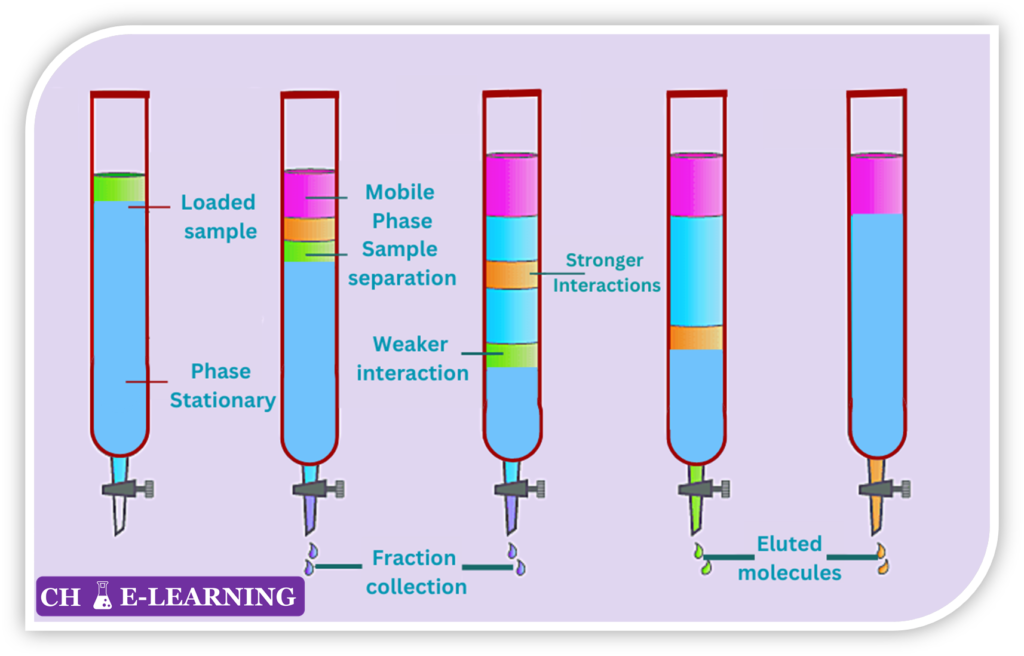
- The stationary phase can be color-packing materials. It should be a porous matrix.
- A sample is allowed to move along the stationary phase with the aid of the mobile phase.
Common types of chromatography include:
Gas chromatography (GC): Separates volatile compounds based on their partitioning between a gas-mobile phase and a stationary phase.
Liquid chromatography (LC): Separates compounds using a liquid mobile phase and a stationary phase, such as a solid or a liquid-coated solid.
High-performance liquid chromatography (HPLC): A more advanced form of liquid chromatography that provides higher resolution and sensitivity.
Instrumental Methods of Quantitative Analysis:
They are used to accurately determine the concentration or amount of a specific analyte in a sample. Here are some common instrument methods of quantitative analysis:
Mass Spectroscopy::
It is a powerful technique used for determining the molecular mass of a compound and its elemental composition. It can be used for the isolation of isotopes.
Ionization: In mass spectroscopy, sample molecules are bombarded with a beam of electrons, causing them to become ionized.
- As a result of ionization, the sample molecules break up into positively charged fragments, known as ions.
Electric and Magnetic Fields: The ionized fragments are then subjected to electric and magnetic fields.
- These fields act to separate the ions based on their mass-to-charge ratio (m/e ratio).
- The electric field accelerates the ions, while the magnetic field causes them to move in curved paths.

Mass-to-Charge Ratio Measurement: Each type of ion has a specific mass-to-charge ratio (m/e ratio).
- The mass spectrometer measures the m/e ratio of the ions.
- This measurement is achieved by applying electric and magnetic fields of varying strengths to the ions, causing them to move along a predetermined path.
Intensity Plot: The measured m/e ratios are plotted against their corresponding intensities, which represent the abundance or quantity of each ion detected.
- The resulting plot is called a mass spectrum. The mass spectrum provides valuable information about the composition and structure of the compound under analysis.
